BUYERS & SELLERSReal Estate Local Market August 21, 2022

InterNACHI’s Estimated Life Expectancy Chart for Florida Homes, AUG, 2022

SOURCE: https://www.nachi.org/myowncopy.htm

The following chart details the predicted life expectancy of appliances, products, materials, systems and components for homes in the state of Florida.  (It may also be applicable to
states in the nearby coastal region with similar climate and weather conditions on a typical basis.)
While many components and systems in homes located in Florida and the surrounding area have service life expectancies that are comparable to those anywhere else in the U.S., those items that are regularly exposed to saltwater, wind, sun and heat are particularly vulnerable to premature failure compared to items installed in homes located elsewhere.  These guidelines attempt to address those differences.
Furthermore, Florida inspectors are subject to state requirements for reporting deficiencies based on expected service life:

468.8323 Home inspection report.  Upon completion of each home inspection for compensation, the home inspector shall provide a written report prepared for the client.

(1) The home inspector shall report:

(a) on those systems and components inspected that, in the
professional opinion of the inspector, are significantly deficient or
are near the end of their service life;
(b) if not self-evident, a reason why the system or component reported
under paragraph (a) is significantly deficient or near the end of its
service life.

(For a comparison of service life expectancies in other areas of the U.S., see InterNACHI’s Estimated Life Expectancy Chart for Homes.)
Consumers, inspectors, and professionals advising their clients should note that these life expectancies have been determined through research and testing based on regular recommended maintenance and conditions of normal wear and tear, and not extreme weather (or other) conditions, neglect, over-use or abuse.  Therefore, they should be used as guidelines only, and not relied upon as guarantees or warranties.  
 

*********************************************************************** 

Surface preparation and paint quality are the most important determinants of a paint’s life expectancy. Ultraviolet (UV) rays can shorten life expectancy, especially in coastal regions that experience a lot of sunshine and heat, as well as wind-driven rain.  Additionally, conditions of high humidity indoors or outdoors can affect the lifespan of these components, which is why they should be maintained seasonally.
ADHESIVES, CAULK & PAINTS
YEARS
Caulking (interior)
5 to 8
Caulking (exterior)
1 to 3
Construction Glue
10+
Paint (exterior)
5
Paint (interior)
8 to 12
Roofing Adhesives/Cements
8+
Sealants
5
Stains
2 to 6
Appliance life expectancy depends to a great extent on the use it receives. Furthermore, consumers often replace appliances long before they become worn out due to changes in styling, technology and consumer preferences.
APPLIANCES       
YEARS
Air Conditioner (portable/window)
5 to 7
Compactors (trash)
6
Dehumidifier
8
Dishwasher
9
Disposal (food waste)
12
Dryer Vent (plastic)
5
Dryer Vent (steel)
20
Dryer (clothes)
13
Exhaust Fans
10
Freezer
10 to 20
Gas Oven
10 to 18
Hand Dryer
10 to 12
Humidifier (portable)
8 (if used)
Microwave Oven
9
Range/Oven Hood
14
Electric Range
13 to 15
Gas Range
15 to 17
Refrigerator
9 to 13
Swamp Cooler
5 to 15
Washing Machine
5 to 15
Whole-House Vacuum System
20
Modern kitchens are larger and more elaborate, and together with the family room, modern kitchens now form the “great room.”
CABINETRY & STORAGE    
YEARS
Bathroom Cabinets
50+
Closet Shelves 100+
Entertainment Center/Home Office 10
Garage/Laundry Cabinets 70+
Kitchen Cabinets 50
Medicine Cabinet 25+
Modular (stock manufacturing-type)
50
Walls and ceilings last the full lifespan of the home.
CEILINGS & WALLS
YEARS
Acoustical Tile Ceiling
40+ (older than 25 years may contain asbestos)
Ceramic Tile
70+
Concrete
75+
Gypsum
75
Wood Paneling
20 to 50
Suspended Ceiling
25+
Natural stone countertops, which are less expensive than they were just a few years ago, are becoming more popular, and one can expect them to last a lifetime. Cultured marble countertops have a shorter life expectancy, however.
COUNTERTOPS
YEARS
Concrete
50
Cultured Marble
20
Natural Stone
100+
Laminate
20 to 30
Resin
10+
Tile
100+
Wood
100+
Decks are exposed to a wide range of conditions in different climates, from wind and hail in some areas, to relatively consistent, dry weather in others. See FASTENERS & STEEL section for fasteners.
DECKS
YEARS 
Deck Planks
10
Composite
8 to 15
Structural Wood
5 to 20
Exterior fiberglass, steel and wood doors will last as long as the house, while vinyl and screen doors have a shorter life expectancy. The gaskets/weatherstripping of exterior doors may have to be replaced every five to eight years.
DOORS
YEARS
Closet (interior)
100+
Fiberglass (exterior)
100+
Fire-Rated Steel (exterior)
100+
French (interior)
30 to 50
Screen (exterior) 10
Sliding Glass/Patio (exterior)
10 (for roller wheel/track repair/replacement)
Vinyl (exterior) 10
Wood (exterior)
30+
Wood (hollow-core interior)
20 to 30
Wood (solid-core interior)
30 to 100+
Copper-plated wiring, copper-clad aluminum, and bare copper wiring are expected to last a lifetime, whereas electrical accessories and lighting controls, such as dimmer switches, may need to be replaced after 10 years.  GFCIs could last 30 years, but much less if tripped regularly.  Remember that faulty, damaged or overloaded electrical circuits or equipment are the leading cause of house fires, so they should be inspected regularly and repaired or updated as needed.
ELECTRICAL
YEARS
Accessories
10+
Arc-Fault Circuit Interrupters (AFCIs)
30
Bare Copper
100+
Bulbs (compact fluorescent)
8,000 to 10,000+ hours
Bulbs (halogen)
4,000 to 8,000+ hours
Bulbs (incandescent)
1,000 to 2,000+ hours
Bulbs (LED)
30,000 to 50,000+ hours
Copper-Clad Aluminum
100+
Copper-Plated
100+
Fixtures
40
Ground-Fault Circuit Interrupters (GFCIs)
up to 30
Lighting Controls
30+
Residential Propane Backup Generator
12
Service Panel
60
Solar Panels
20 to 30
Solar System Batteries
3 to 12
Wind Turbine Generator
20
Floor and roof trusses and laminated strand lumber are durable household components, and engineered trim may last 30 years.
ENGINEERED LUMBER
YEARS
Engineered Joists
80+
Laminated Strand Lumber
100+
Laminated Veneer Lumber
80+
Trusses
100+
Fastener manufacturers do not give lifespans for their products because they vary too much based on where the fasteners are installed in a home, the materials in which they’re installed, and the local climate and environment.  However, inspectors can use the guidelines below for humid and coastal environments to make educated judgments about the materials they inspect.
FASTENERS, CONNECTORS & STEEL
YEARS
Adjustable Steel Columns
50+
Fasteners (bright)
25 to 40
Fasteners (copper)
50 to 65
Fasteners (electro-galvanized)
10 to 30
Fasteners (hot-dipped galvanized)
15 to 60
Fasteners (stainless)
100
Steel Beams
50 to 100+
Steel Columns 100+
Steel Plates 35 to 75
Flooring life is dependent on maintenance and the amount of foot traffic the floor endures.
FLOORING
YEARS
All Wood Floors
100+
Bamboo
100+
Brick Pavers
100+
Carpet
8 to 10
Concrete
50+
Engineered Wood
50+
Exotic Wood
100+
Granite
100+
Laminate
15 to 25
Linoleum
25
Marble
100+
Other Domestic Wood
100+
Slate
100
Terrazzo
75+
Tile
75 to 100
Vinyl
25
Concrete and poured-block footings and foundations will last a lifetime, assuming they were properly built.  Waterproofing with bituminous coating lasts 10 years, but if it cracks, it is immediately damaged.
FOUNDATIONS 
YEARS
Baseboard Waterproofing System
30
Bituminous-Coating Waterproofing
6
Concrete Block
75+
Insulated Concrete Forms (ICFs)
80
Post and Pier
15 to 45
Post and Tensioned Slab on Grade
80+
Poured-Concrete Footings and Foundation
80+
Slab on Grade (concrete)
75
Wood Foundation
5 to 20
Permanent Wood Foundation (PWF; treated)
50 to 75
Framing and structural systems have extended longevities; poured-concrete systems, timber-frame houses, and structural insulated panels will all last a lifetime.
FRAMING 
YEARS
Log
75+
Poured-Concrete Systems
80+
Steel
75+
Structural Insulated Panels (SIPs)
75+
Timber Frame
80+
The quality and frequency of use will affect the longevity of garage doors and openers.
GARAGES
YEARS
Garage Doors
10 to 30
Garage Door Openers
10 to 15
Home technology systems have diverse life expectancies and may have to be upgraded due to evolution in technology.
HOME TECHNOLOGY
YEARS
Built-In Audio
20
Carbon Monoxide Detectors* 5
Doorbells
35
Home Automation System
5 to 50
Intercoms
20
Security System
5 to 20
Smoke/Heat Detectors*
less than 10
Wireless Home Network
5 to ?
* Batteries should be changed at least annually.
Thermostats may last 35 years but they are usually replaced before they fail due to technological improvements.
HVAC
YEARS
Air Conditioner (central)
5 to 12
Air Exchanger
15
Attic Fan
15 to 25
Boiler
40 (if installed)
Burner
10+
Ceiling Fan
5 to 10
Condenser
5 to 7 (for coastal areas, or 15 to 20 inland)
Dampers
20+
Dehumidifier
8
Diffusers, Grilles and Registers
25
Ducting
60 to 100
Electric Radiant Heating
40
Evaporative Cooler
15 to 25 (if installed)
Furnace
15 to 25 (if installed)
Gas Fireplace
15 to 25
Handler Coil
1 to 3
Heat Exchanger
10 to 15
Heat Pump
10 to 15
Heat-Recovery Ventilator
20
Hot-Water and Steam-Radiant Boilers
40
Humidifiers
12 (if installed)
Induction and Fan-Coil Units
10 to 15
Chimney Cap (concrete)
50+
Chimney Cap (metal)
8 to 10
Chimney Cap (mortar)
10+
Chimney Flue Tile
20+
Thermostats
35
Ventilator 7
As long as they are not punctured, cut or burned, and are kept dry and away from UV rays, cellulose, fiberglass and foam insulation materials will last a lifetime. This is true regardless of whether they were installed as loose-fill, housewrap, or batts/rolls.
INSULATION & INFILTRATION BARRIERS
YEARS
Batts/Rolls
100+
Black Paper (felt paper)
15 to 30
Cellulose
100+
Fiberglass
100+
Foamboard
100+
Housewrap
80+
Liquid-Applied Membrane
50
Loose-Fill
100+
Rockwool
100+
Wrap Tape
80+
Masonry is one of the most enduring household components. Fireplaces, chimneys and brick veneers can last the lifetime of the home.
MASONRY & CONCRETE    
YEARS
Brick
75+
Insulated Concrete Forms (hybrid block)
75+
Concrete Masonry Units (CMUs)
75+
Man-Made Stone 15
Masonry Sealant
2 to 10
Stone
75+
Stucco/EIFS
25+
Veneer
75+
Custom millwork and stair parts will last a lifetime and are typically only upgraded for aesthetic reasons.
MOLDING, MILLWORK & TRIM 
YEARS
Attic Stairs (pull-down)
50
Custom Millwork
100+
Pre-Built Stairs (interior)
100+
Stair Parts (interior)
100+
Stairs (interior)
100+
The lifetime of any interior wood product depends heavily on moisture intrusion.
PANELS
YEARS
Flooring Underlayment
25
Hardboard
40
Particleboard
60
Plywood
100
Softwood
30
Oriented Strand Board (OSB)
60
Wall Panels
100+
The quality of plumbing fixtures varies dramatically.  The mineral content of water can shorten the life expectancy of water heaters and clog showerheads.  Also, some finishes may require special maintenance with approved cleaning agents per the manufacturers in order to last their expected service life.
PLUMBING, FIXTURES & FAUCETS
YEARS
ABS and PVC Waste Pipe
50 to 80
Accessible/ADA Handles
100+
Acrylic Kitchen Sink
50
Cast-Iron Bathtub
100
Cast-Iron Waste Pipe (above ground)
40
Cast-Iron Waste Pipe (below ground)
50 to 60
Concrete Waste Pipe
100+
Copper Water Lines
70
Enameled Steel Kitchen Sink
5 to 10
Faucets and Spray Hose
15 to 20
Fiberglass Bathtub and Shower
20
Gas Lines (black steel)
75
Gas Lines (flex)
30
Hose Bib
20 to 30
Instant (on-demand) Water Heater
10
PEX 40
Plastic Water Lines
75
Saunas/Steam Room
15 to 20
Sewer Grinder Pump
10
Shower Enclosure/Module
50
Shower Doors
20
Showerheads
100+ (if not clogged by mineral/other deposits)
Soapstone Kitchen Sink
100+
Sump Pump
7
Toilet Tank Components
5
Toilets, Bidets and Urinals
100+ (if not cracked)
Vent Fan (ceiling)
5 to 10
Vessel Sink (stone, glass, porcelain, copper)
5 to 20+
Water Heater (conventional)
6 to 12
Water Line (copper)
50
Water Line (plastic)
50
Well Pump
15
Water Softener
20
Whirlpool Tub
20 to 50

Radon mitigation systems have but one moving part:  the radon fan.

RADON SYSTEMS
YEARS
Air Exchanger
15
Barometric Backdraft Damper/Fresh-Air Intake
20
Caulking
5 to 10
Labeling
25
Manometer
15
Piping
50+
Radon Fan
5 to 8
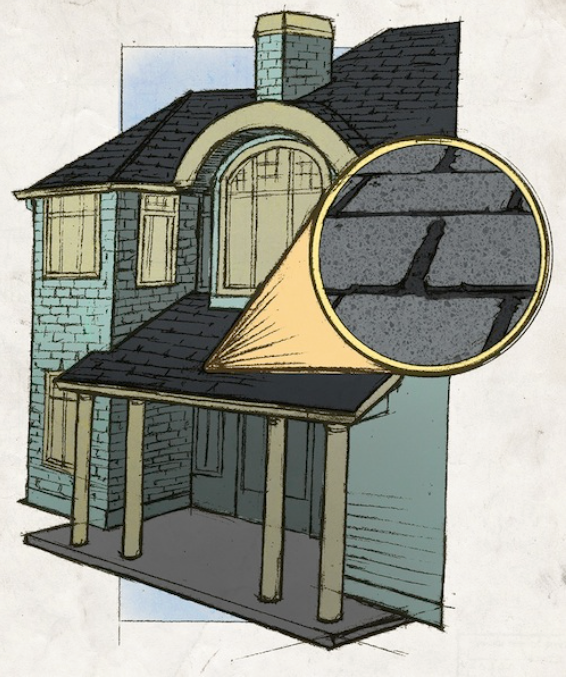
The life of a roof depends on local weather conditions, building and design, material quality, and adequate maintenance.  Hot climates drastically reduce asphalt shingle life.  Roofs in areas that experience severe weather, such as hail, tornadoes and/or hurricanes may also experience a shorter-than-normal lifespan overall or may incur isolated damage that requires repair in order to ensure the service life of the surrounding roofing materials.
ROOFING
YEARS
Aluminum Coating
2 to 6
Asbestos Shakes
30 to 50+
Asphalt Shingles (3-tab)
10 to 12
Asphalt (architectural) 15 to 20
BUR (built-up roofing)
5 to 15
Clay/Concrete
80+
Coal and Tar
18
Copper
50+
EPDM (ethylene propylene diene monomer) Rubber
10 to 15
Fiber Cement
18
Green (vegetation-covered)
5 to 20
Metal
17 to 20
Modified Bitumen
10
Simulated Slate
10 to 25
Slate
50+
TPO 10 to 12
Wood
25
Exterior siding materials typically last a lifetime.  Some exterior components may require protection through appropriate paints or sealants, as well as regular maintenance.  Also, while well-maintained and undamaged flashing can last a long time, it is their connections that tend to fail, so seasonal inspection and maintenance are strongly recommended.
SIDINGS, FLASHING & ACCESSORIES
YEARS
Aluminum Siding
20 to 35
Aluminum Gutters, Downspouts, Soffit and Fascia
15 to 35+
Asbestos Shingle
20
Brick
80+
Cementitious
80+
Copper Downspouts
80
Copper Gutters
40+
Engineered Wood
80+
Fiber Cement
75+
Galvanized Steel Gutters/Downspouts
15
Manufactured Stone
80+
Stone
80+
Stucco/EIFS
25+
Trim 18
Vinyl Siding 50
Vinyl Gutters and Downspouts
20+
Wood/Exterior Shutters 15
Site and landscaping elements have life expectancies that vary dramatically.
SITE & LANDSCAPING
YEARS
American Red Clay
75+
Asphalt Driveway
10 to 15
Brick and Concrete Patio
8 to18
Clay Paving
75+
Concrete Walks
30+
Controllers
12
Gravel Walks
4 to 6
Mulch
1 to 2
Polyvinyl Fencing 75+
Sprinkler Heads 8 to 12
Underground PVC Piping 50+
Valves
12 to 15
Wood Chips
1 to 5
Wood Fencing
10
Swimming pools are comprised of many systems and components, all with varying life expectancies, depending on their exposure to climatic and weather conditions.  Also, proper maintenance is key, especially concerning the pool water’s chemical balance.
SWIMMING POOLS
YEARS
Chlorine Generator (salt water)
5
Cover
3 to 5
Deck Finish (acrylic)
5
Diving Board
8 to 10
Gas Heater
3 to 5
Filter (sand)
5 to 10 (sand must be replaced every 3 years)
Filter (cartridge)
2
Filter Grid (DE)
5
Heat Pump
5 to 8
Interior Finish
10 to 20
Motor*
5 to 8
Vinyl Liner
8 to 10
Pool Lights (fiber optic)
3 to 5
Pool Lights (incandescent)
3
Pool Lights (LED)
5 to 7
Pool Water Heater
5
PVC Ball Valve
up to 2
Shell (concrete)
20+
Shell (fiberglass)
20+
Solar Heater
10 to 20
Waterline Tile
10+
 * Replacement motors tend to last half the lifespan of their original counterparts.
Aluminum windows are expected to last between 15 and 20 years, while wooden windows should last nearly 30 years.
WINDOWS
YEARS
Aluminum/Aluminum-Clad
10 to 15
Double-Pane
5 to 15
Skylights
5 to 15
Jalousie
30 to 40
Window Glazing 8+
Vinyl/Fiberglass Windows
10 to 30
Wood
15+

Note: Life expectancy varies with usage, weather, installation, maintenance, and quality of materials.  This list should be used only as a general guideline and not as a guarantee or warranty regarding the performance or life expectancy of any appliance, product, system or component.

Real Estate Local Market August 19, 2022

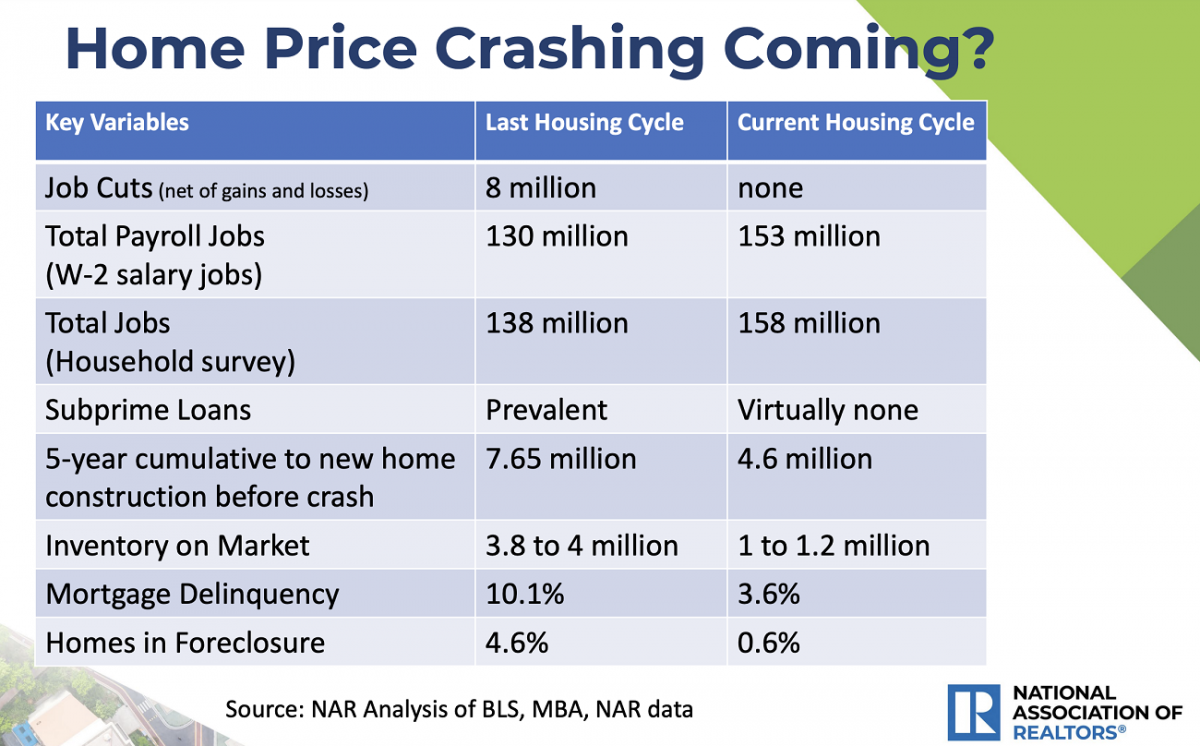
Why a repeat of the 2008 housing crash is unlikely …

With U.S. home prices sharply higher and mortgage rates rising, consumers and investors alike are wondering if the environment for housing is still constructive.

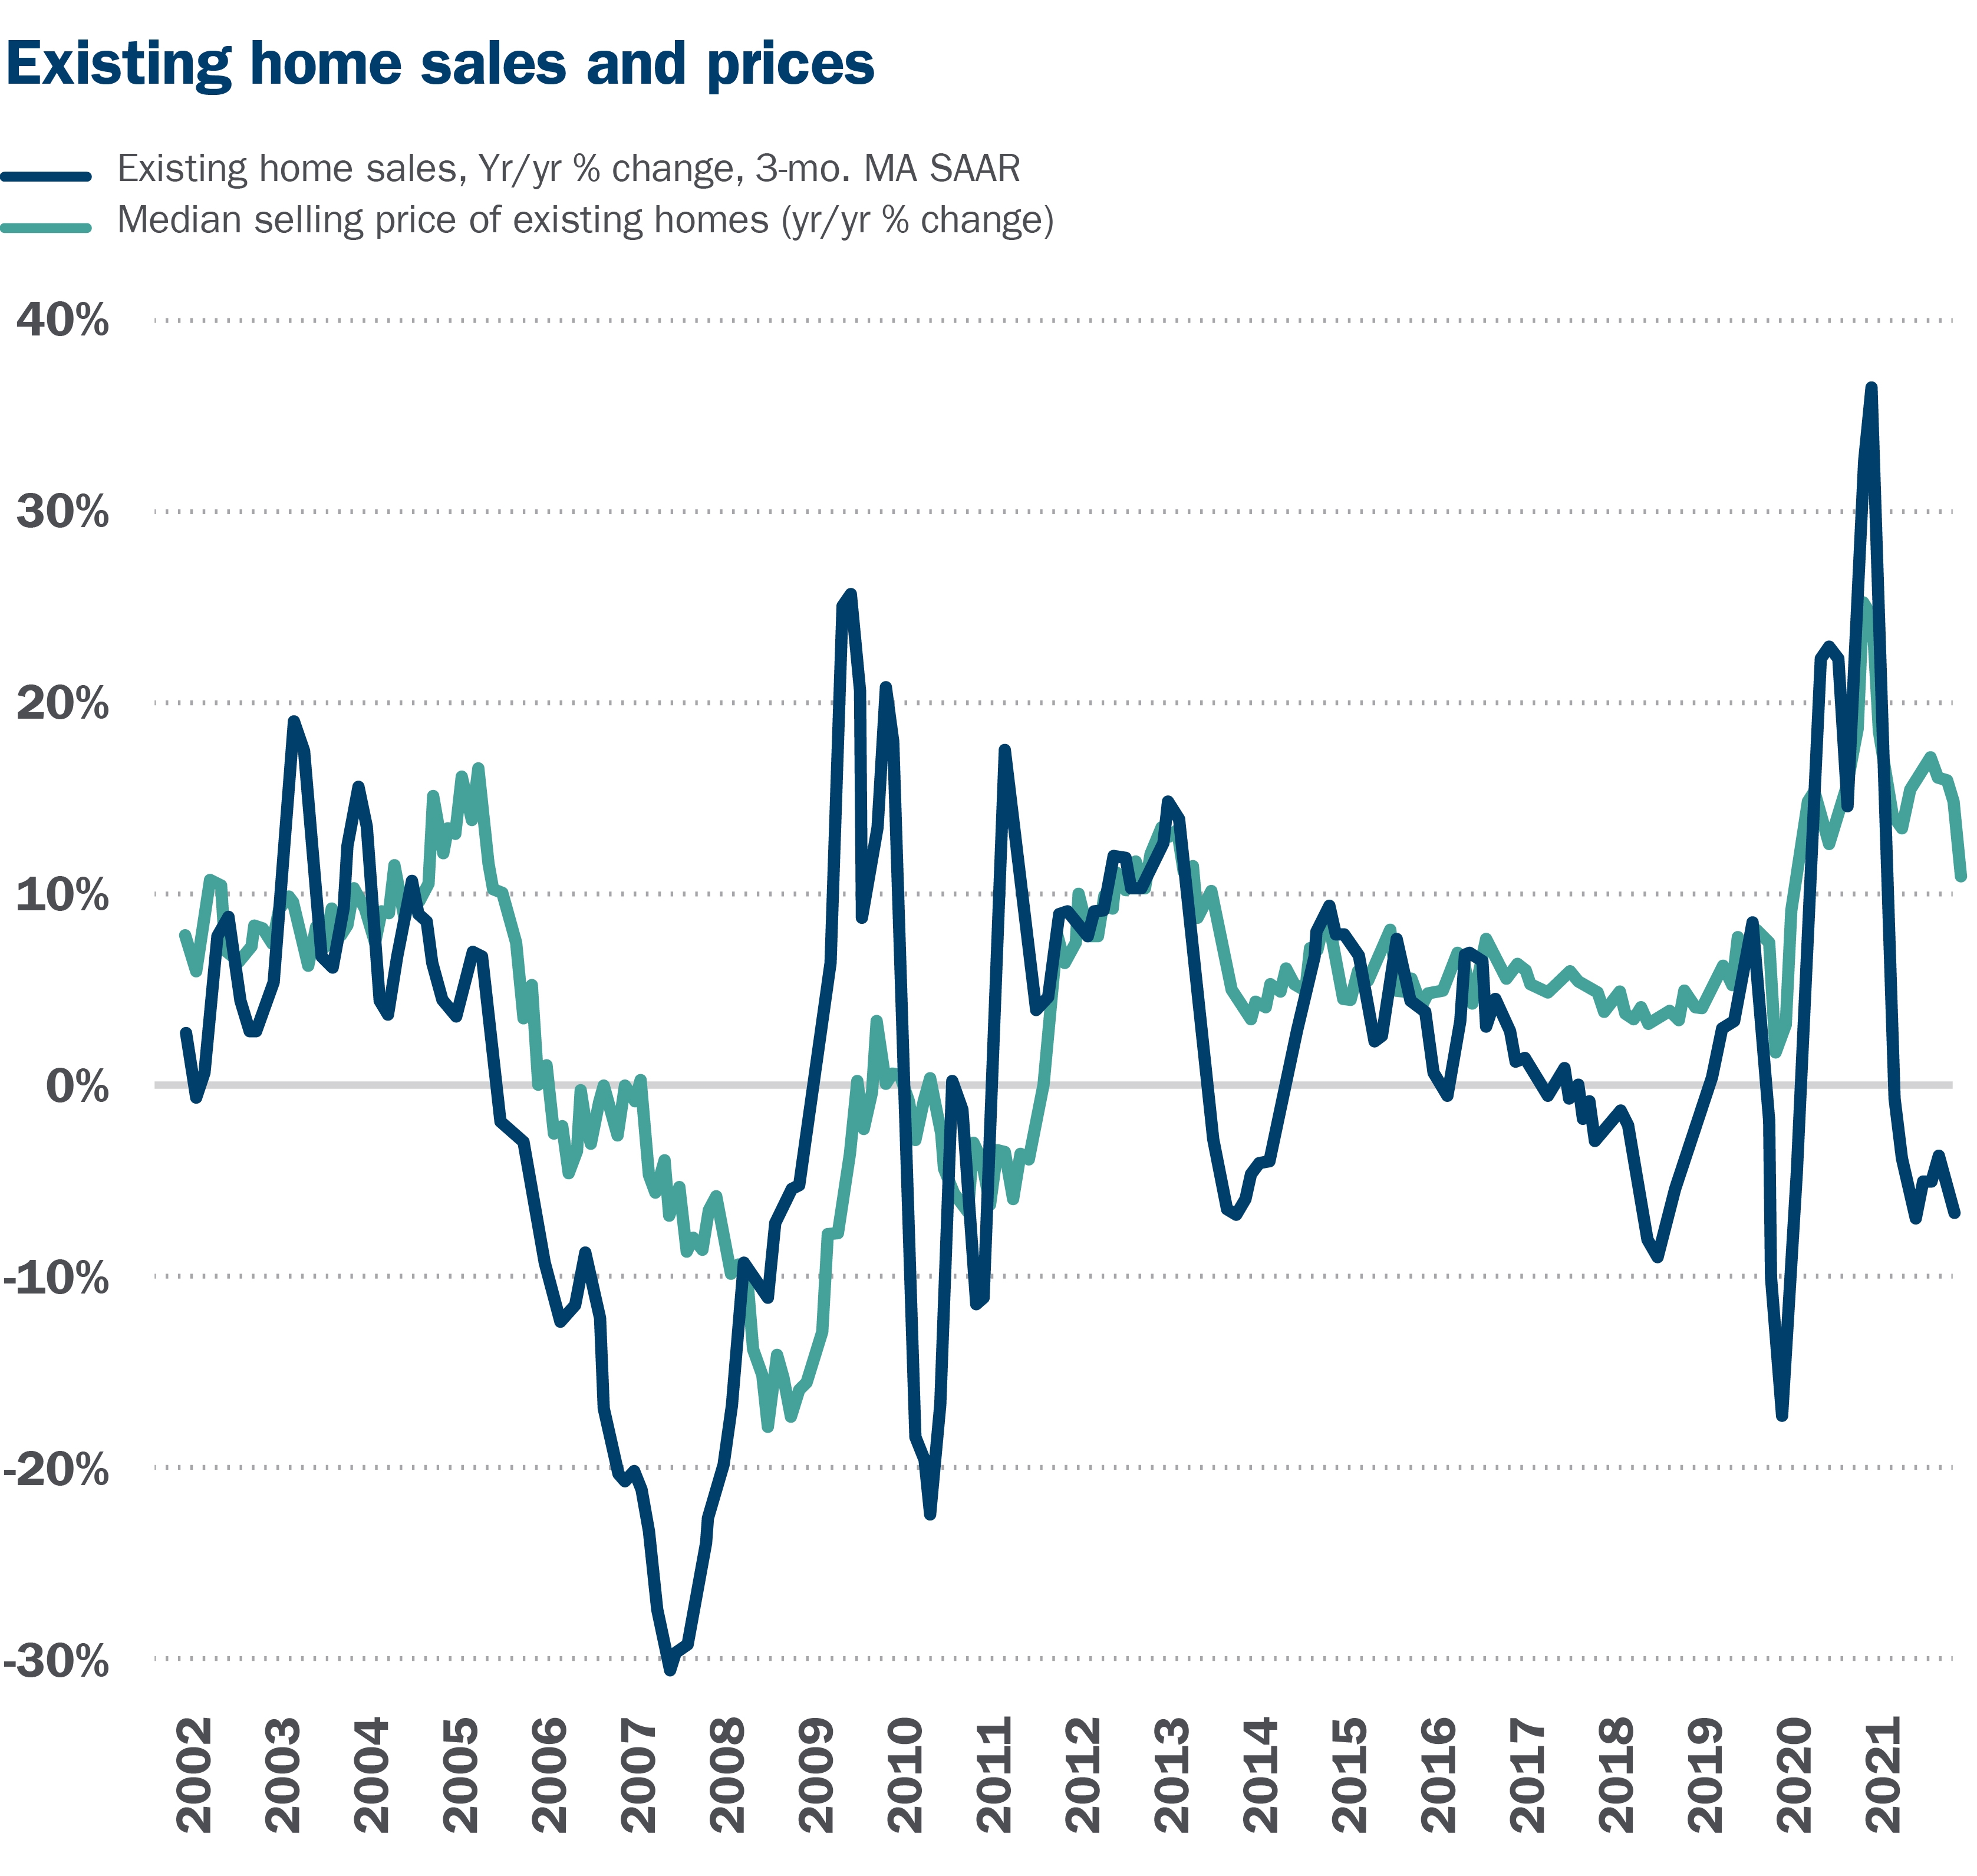
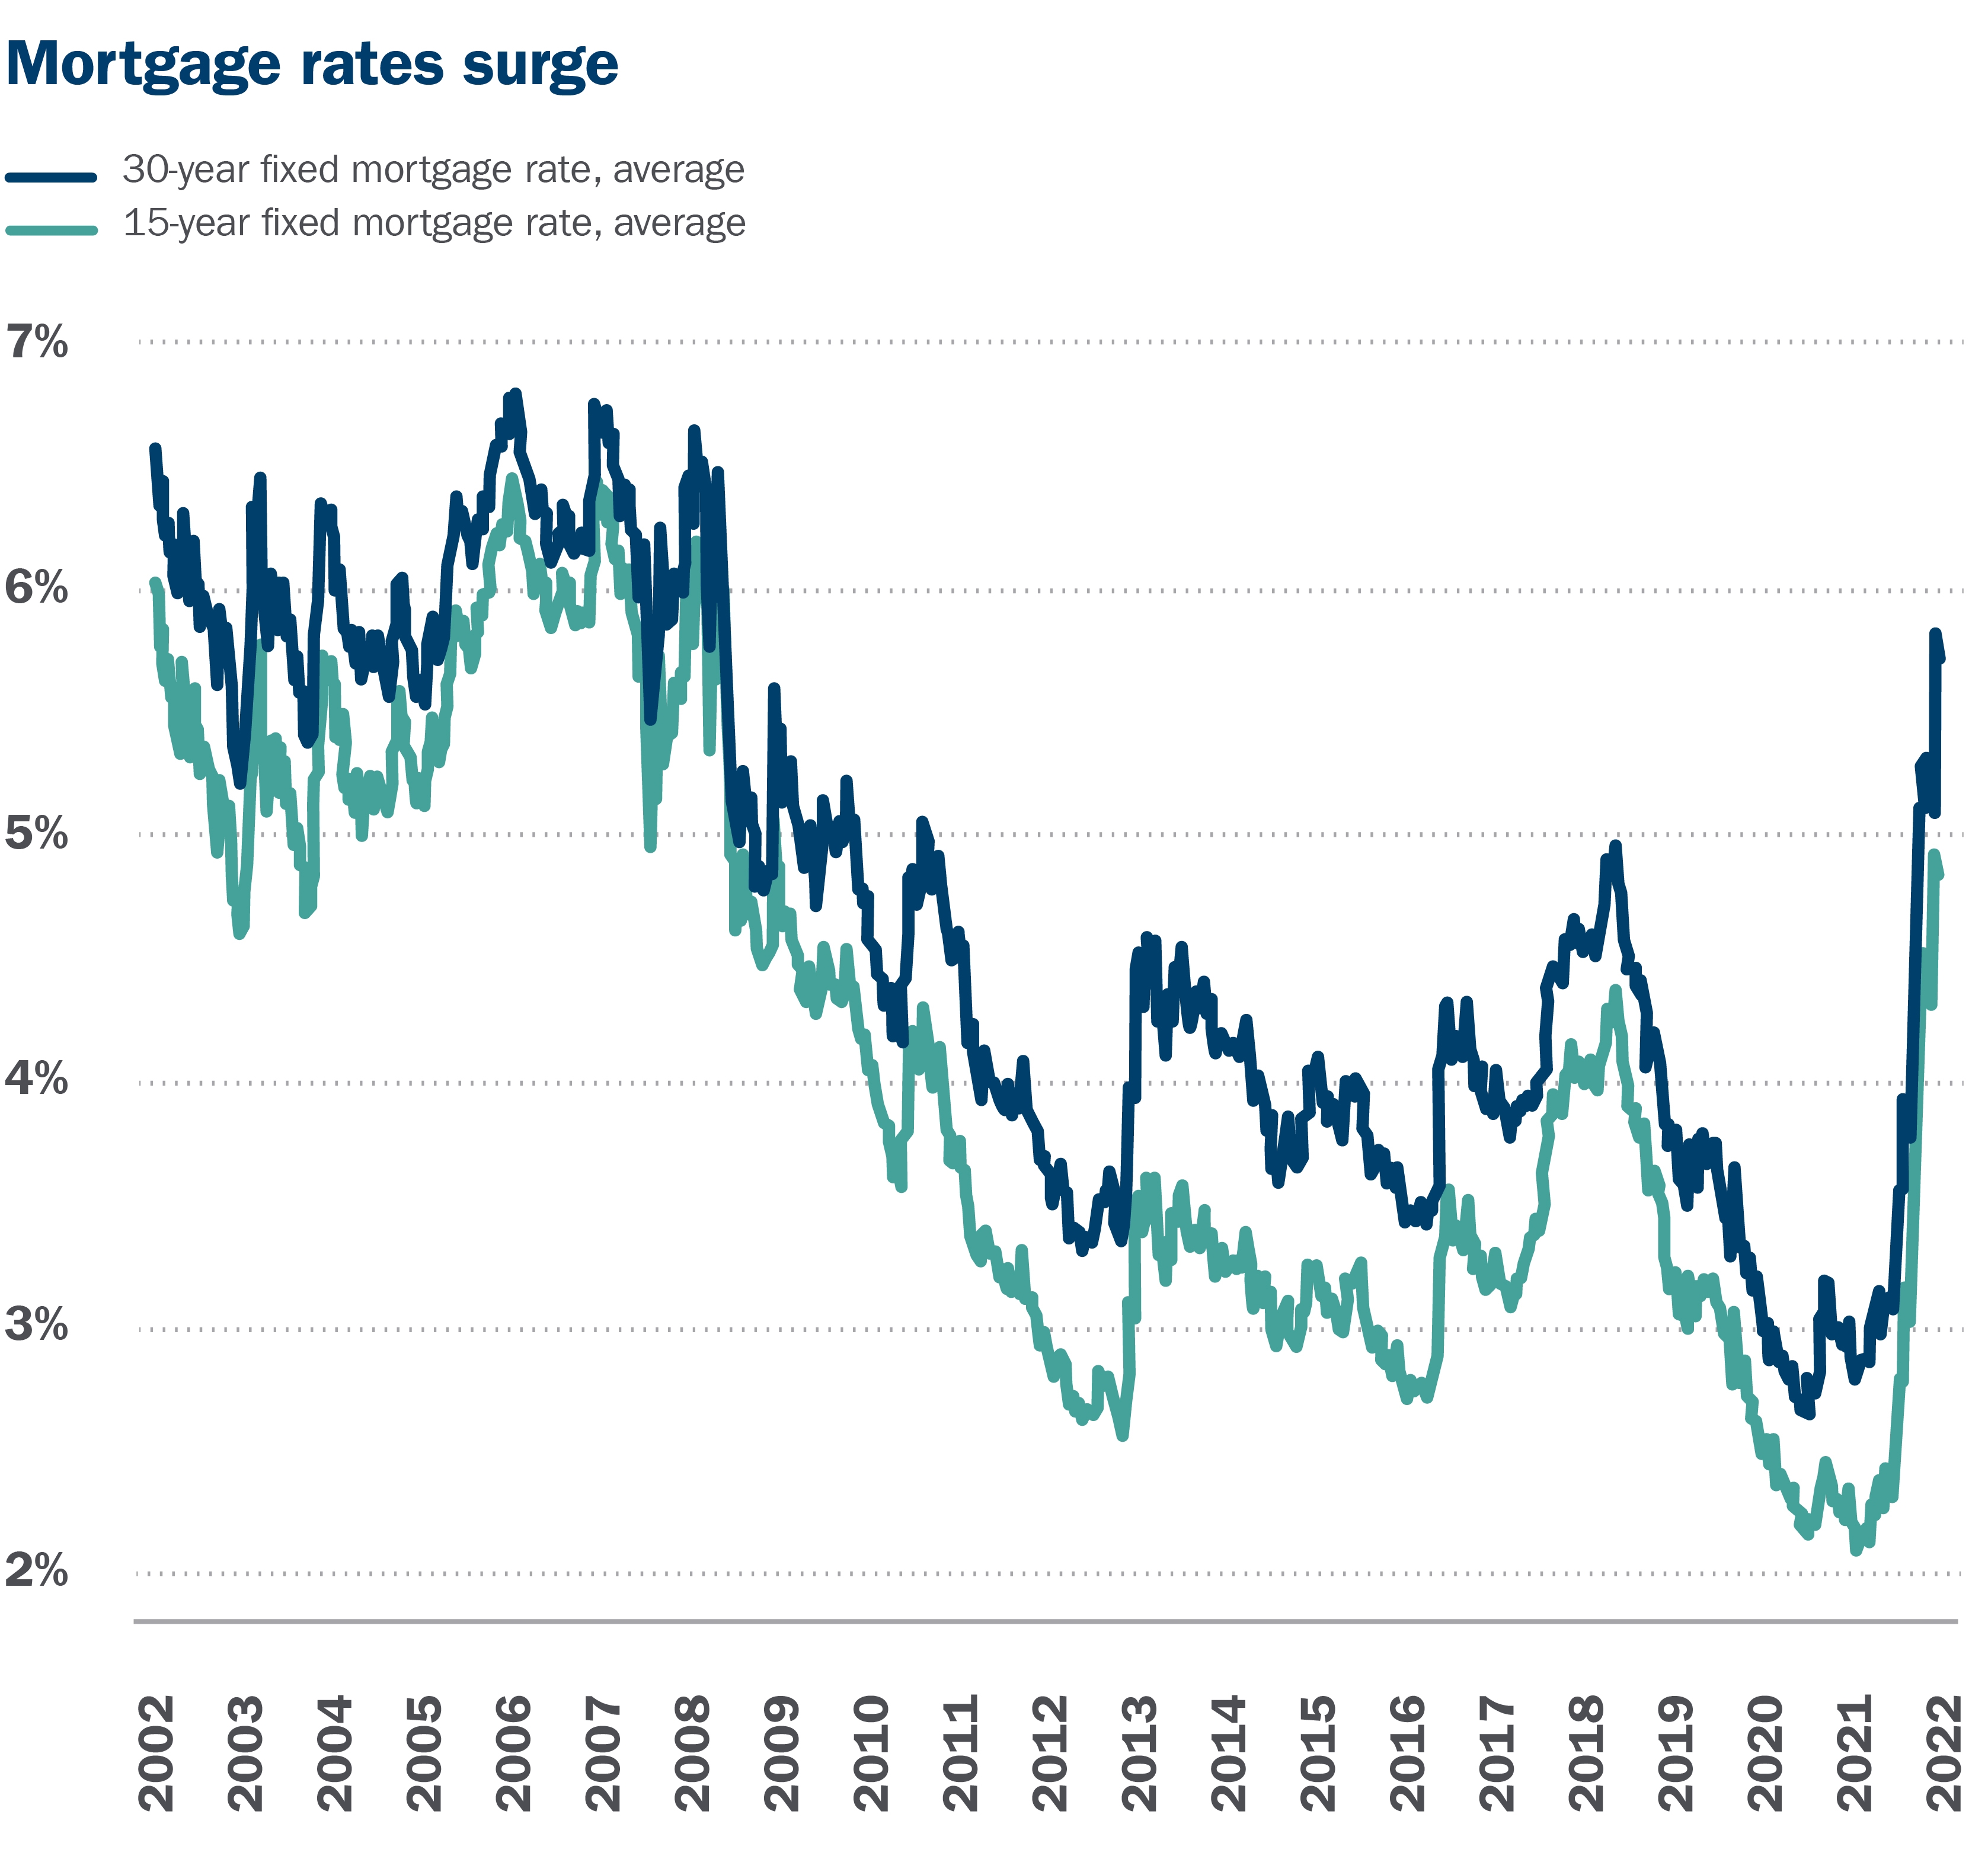
Home prices are on average almost 40% higher than before the pandemic.1 Mortgage rates have jumped over 200 basis points year to date, reducing purchasing power.2 Low affordability suggests that some home purchases may be deferred while some buyers will have to settle for less.

This environment begets the question: Will the U.S. housing market face a major reckoning, like it did in 2008?

Here are four key reasons that suggest the bottom will not fall out of the housing market:

1. Demand for housing is constant

Consumer sentiment surveys suggest it is a bad time to buy. However, what consumers say and what they do is often different. While demand may decline, it will not be erased. Life changes still necessitate home buying. And with high occupancy rates and rising rents, rentals are not an attractive alternative.

2. A repeat of the Global Financial Crisis is unlikely

To improve affordability, increasing the availability of credit by loosening standards is likely. However, it’s unlikely we will see a repeat of pre-Global Financial Crisis affordability products that helped create the housing crisis, such as adjustable-rate mortgages (ARMs) with low teaser rates or pay-option ARMs.

3. Tight supply may offset declining demand

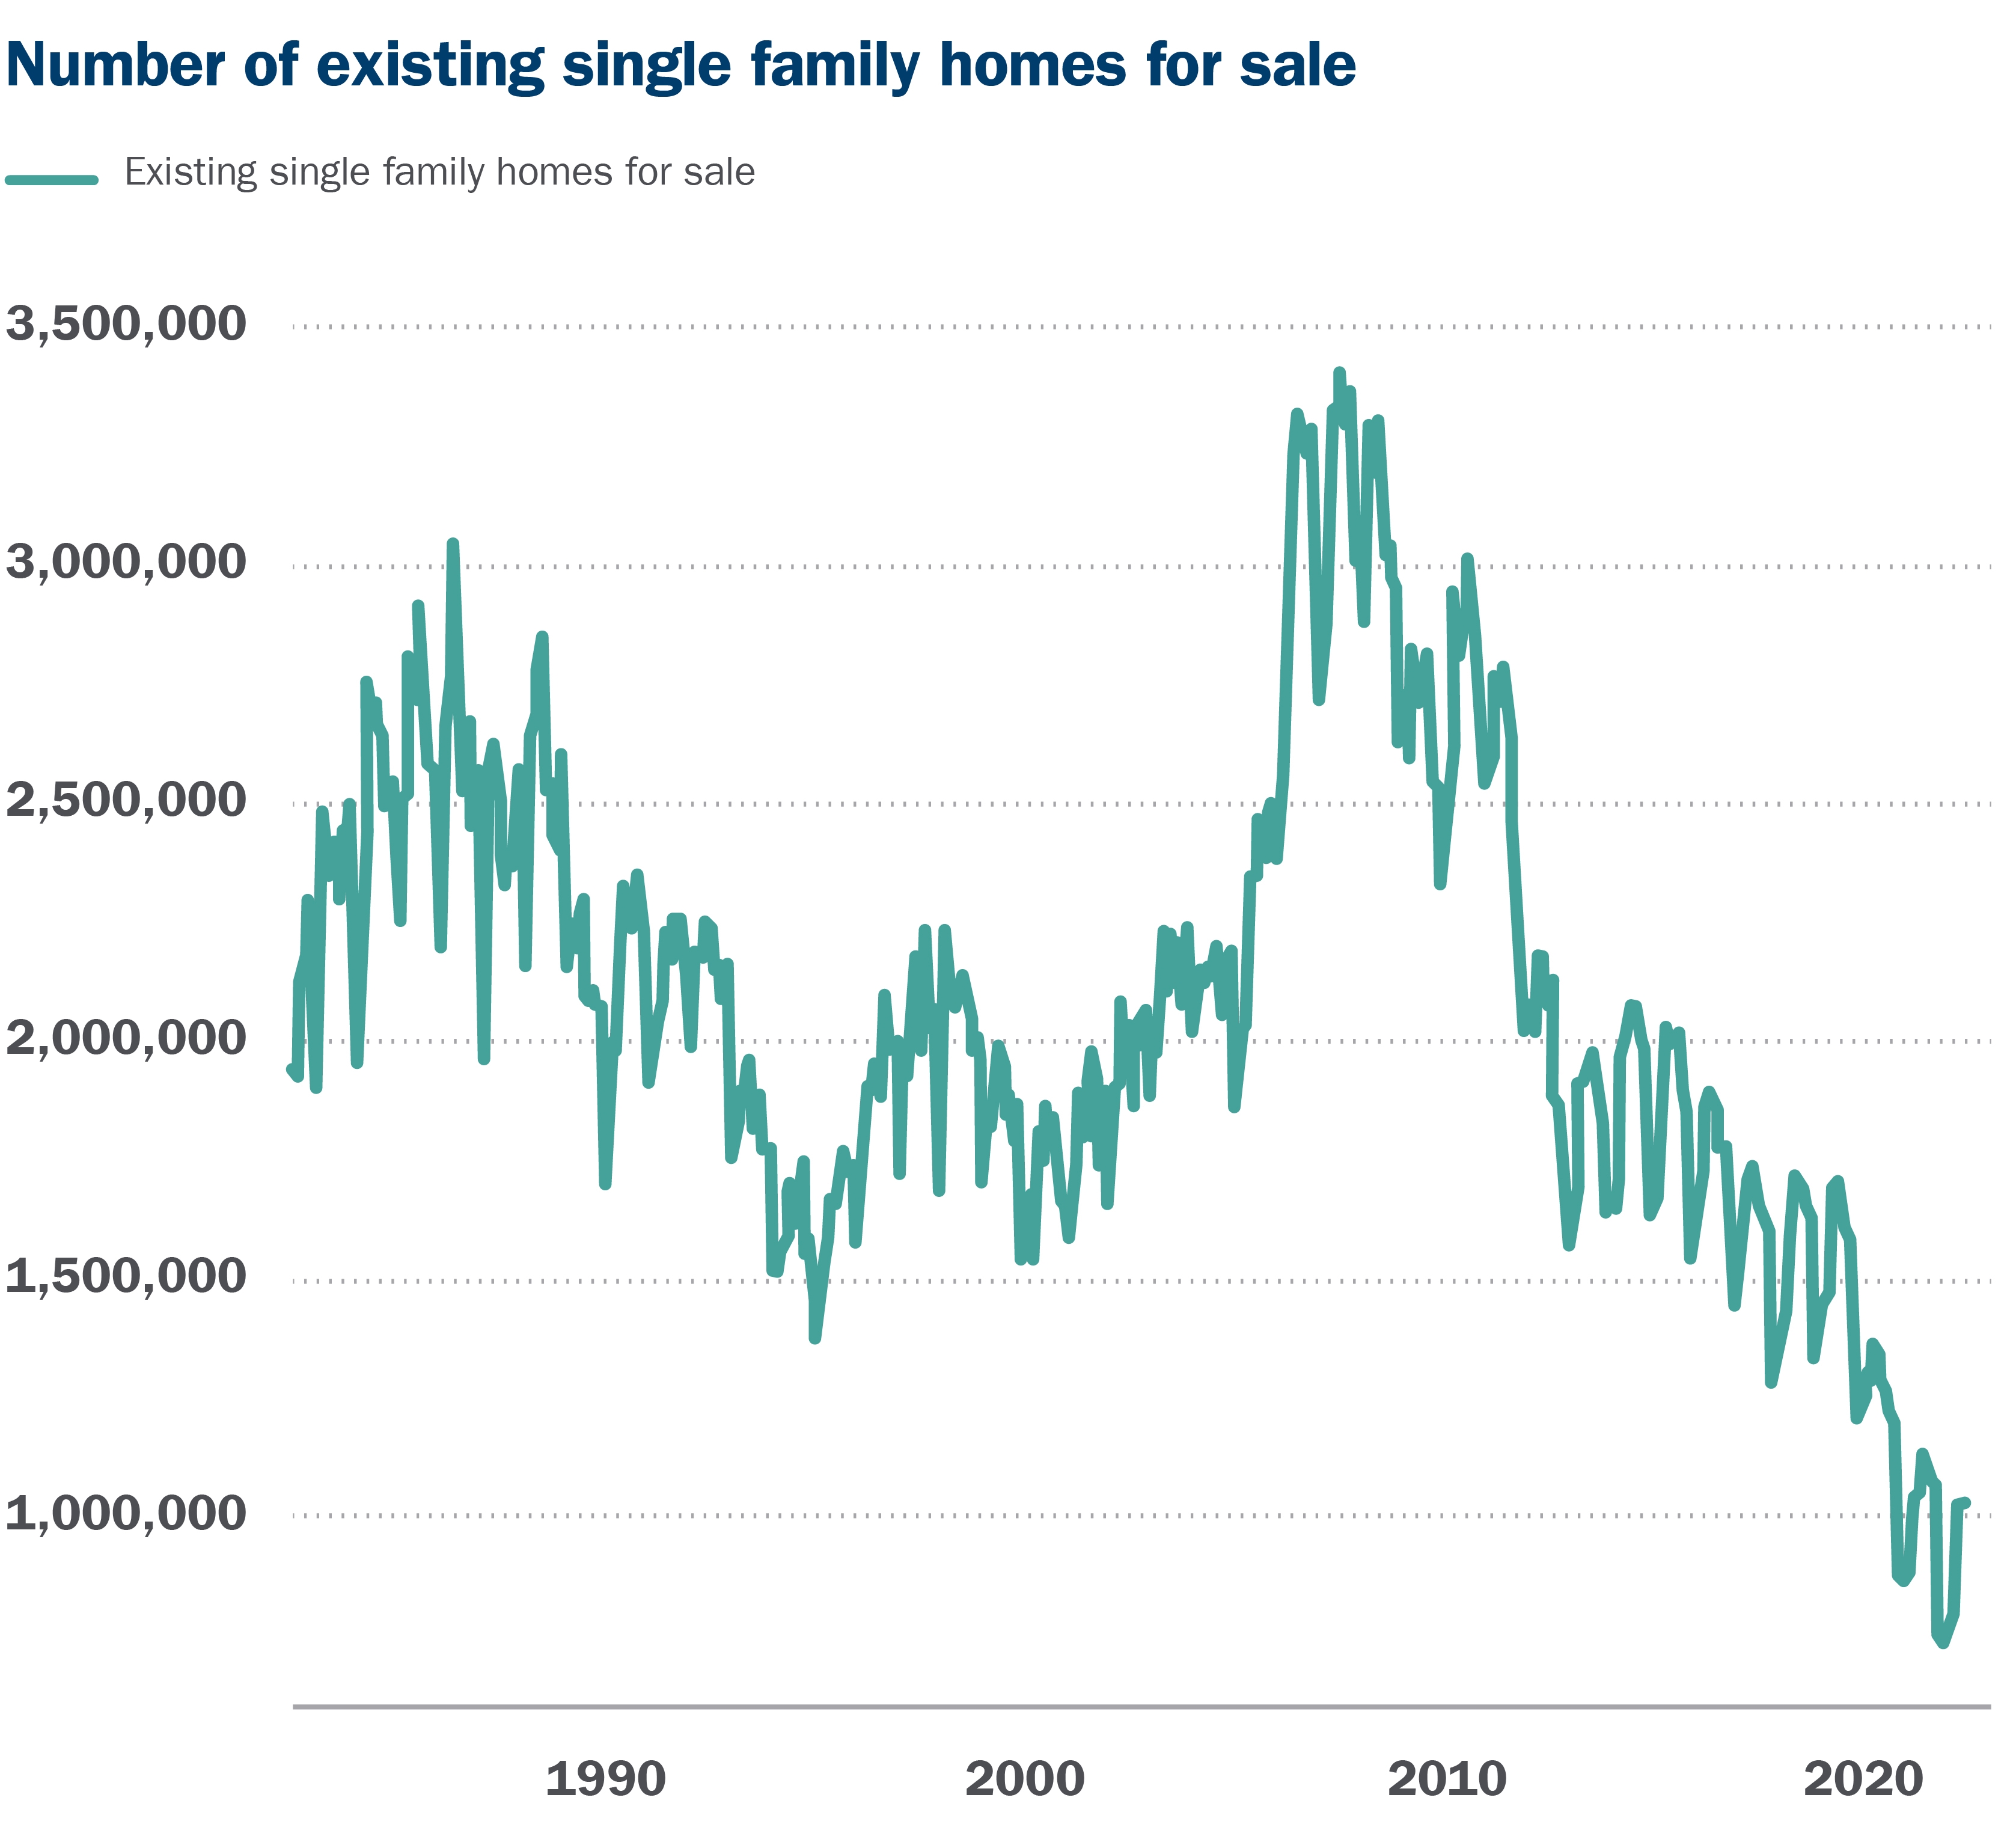
Housing volumes are likely to fall substantially, a trend we are currently experiencing. But we expect the effect that declining demand will have on home prices will be partially mitigated by tight supply. While tight supply may ease in the near term, estimates indicate a shortage of three to seven million homes nationally, and new home building is insufficient to close this gap quickly. In part, homebuilders are reluctant to sell unbuilt houses, given inflation in materials and labor could cut into margins. Another factor expected to weigh on supply is the lock-in effect. The average homeowner’s mortgage rate is almost two and a half percent below the prevailing rates — discouraging those hoping to move.

4. Existing borrowers are in strong condition

While the situation for house hunters is challenging, existing borrowers are generally in good shape. Unlike during pre-Global Financial Crisis conditions, over 90% of borrowers have fixed rates.3 About two-thirds of the mortgage market has turned over since the start of the pandemic, with some of the tightest and most conservative underwriting standards in history, as well as some of the lowest interest rates.4 In addition, existing homeowners generally have significant equity in their homes. This means a spike in the supply from bank foreclosures is unlikely.

Will the bottom fall out?

Supply and demand drive the housing market, and affordability is critical for new and existing homebuyers. That said, as a result of these supportive supply and borrower credit factors, the bottom is not likely to fall out of the housing market. While it’s unknown if the economy will have a hard or a soft landing, supply and demand dynamics will likely result in flat to moderate home price appreciation, with modest home price depreciation a possible scenario in the event of a recession.

Aug. 15, 2022.  by MFS Investment Management, Paul Schur Advisor
Real Estate Local Market August 19, 2022

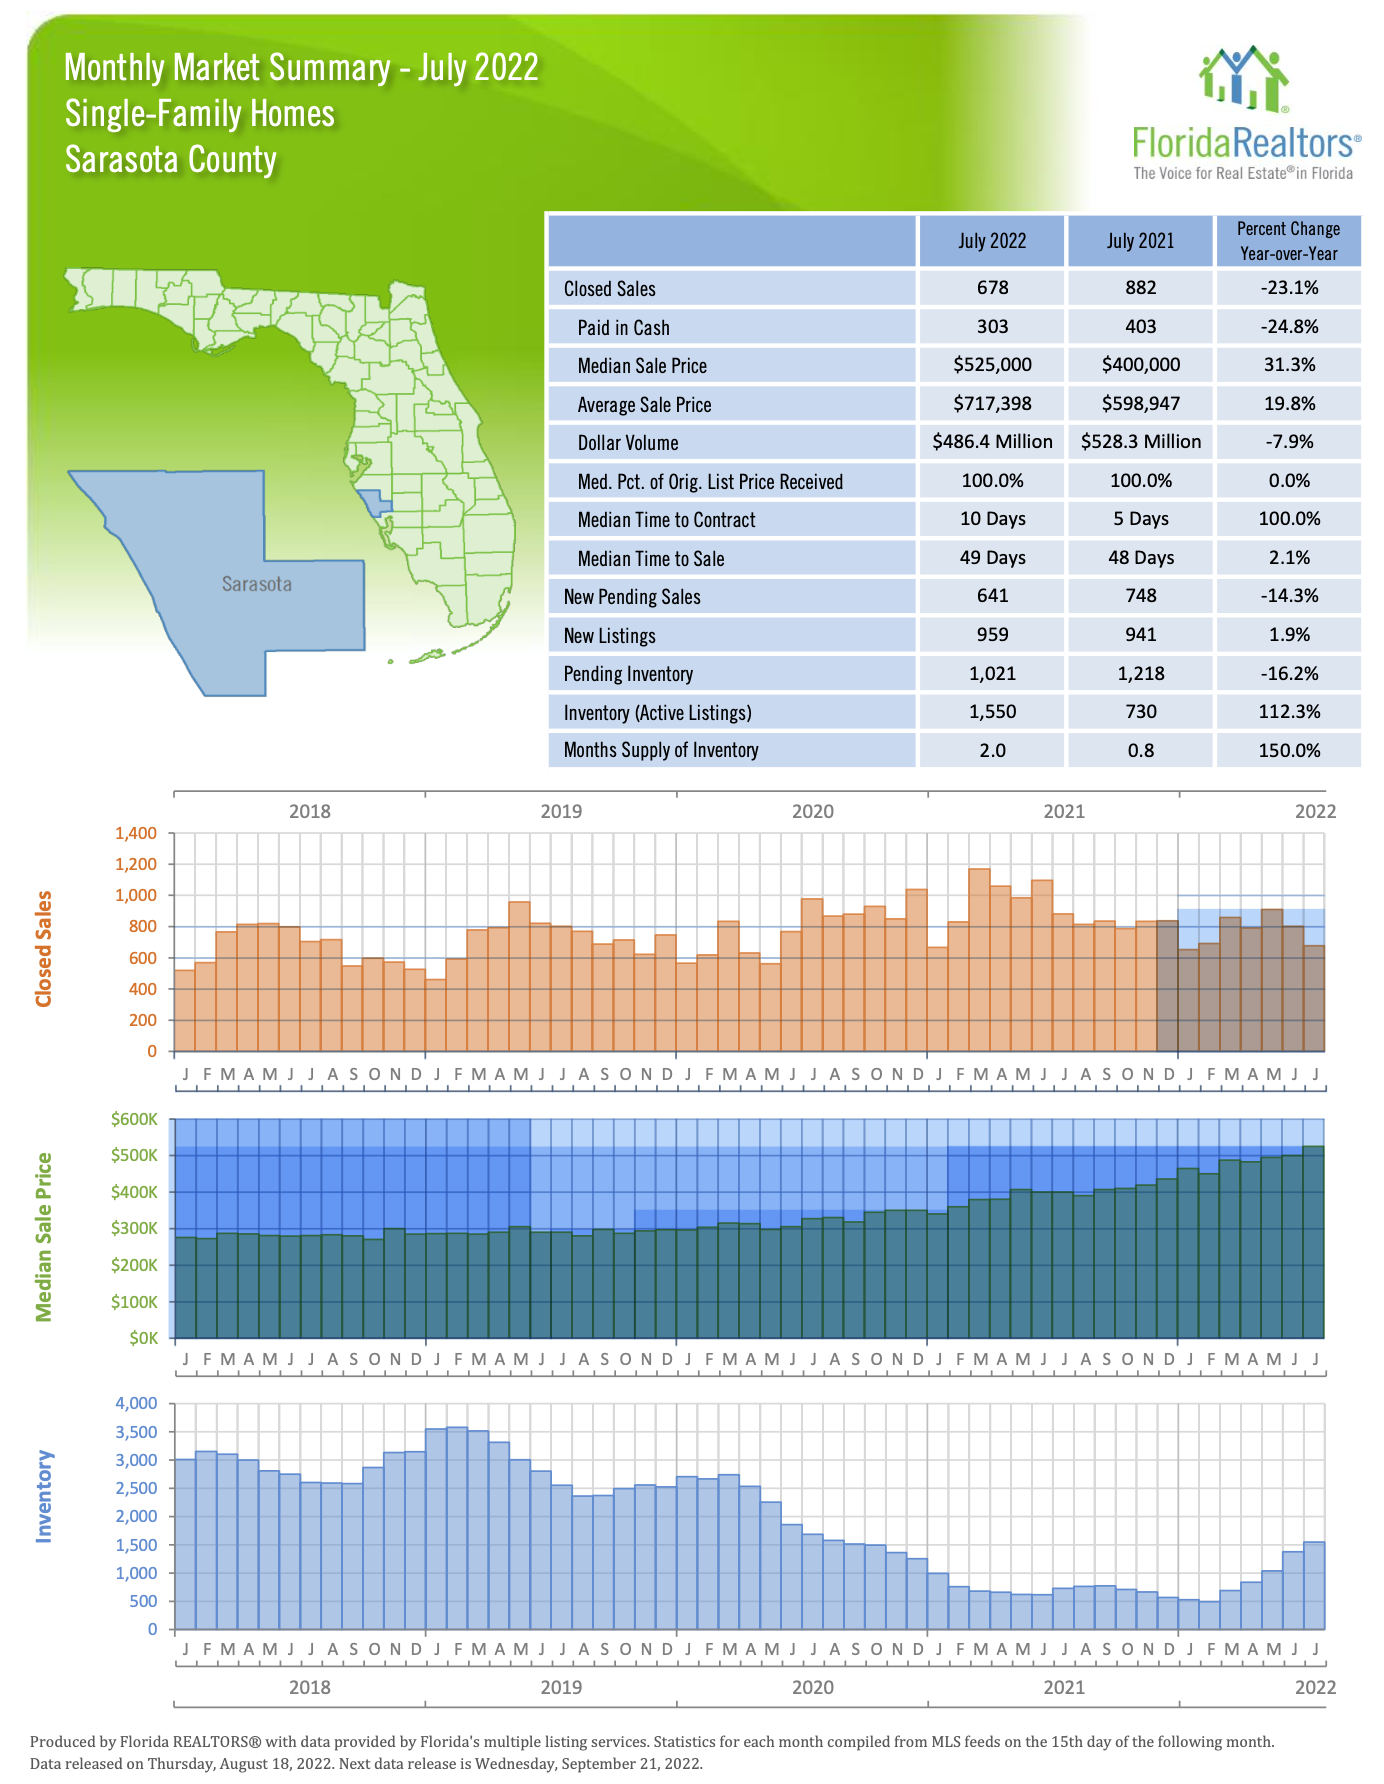
July 2022 – Local Market Snapshot

CLOSED SALES DECREASE IN SARASOTA AND MANATEE AS INVENTORY CONTINUES TO GROW

Click here for the July 2022 Press Release and Statistics.

The inventory of active listings in the two-county region continues to increase year-over-year in July 2022. According to data from Florida REALTORS® and compiled by the REALTOR® Association of Sarasota and Manatee (RASM), closed sales have once again decreased overall, while the month supply of inventory increases, along with the median time to contract. Another month of record-high prices coupled with the rising mortgage rates point to the increase in inventory this month, with active listings increasing by more than 100 percent from last year.

REALTORS® participated in 1,738 sales across the two-county region in July, a 22.8 percent decrease from the same month last year. In Manatee County, single-family sales decreased from last year by 22.2 percent to 567 sales, while condo sales decreased by 20.9 percent to 204 closed sales. In Sarasota County, single-family sales decreased by 23.1 percent to 678 sales, and condo sales are down by 24.5 percent to 289 sales.

“With higher interest rates and inflation impacting our market, the number of sales continues to decrease and the number of properties actively on the market continues to increase,” said 2022 RASM President Tony Veldkamp. “While our active inventory of single-family homes has finally reached a two-month supply in both counties, we deem a healthy balanced market as a six-month supply.”

The median sales price in the two-county area continues to increase, with Sarasota County seeing record- high prices. In Sarasota County, the median price for single-family homes increased by 31.3 percent year- over-year to the highest recorded price of $525,000, while condo prices increased by 24.1 percent to $390,990.

In Manatee County, single-family home prices increased year-over-year by 21.2 percent to $521,000. The median price of condos in Manatee County was $354,500, which is a 41.8 percent increase from last year…

For more More and Graphs : click here

NATIONAL MARKET UPDATE

Realtor.com reports active inventory continues to grow, up 30% from a year ago. This jump in supply gives today’s shoppers an extra home to consider for every three that were on the market this time last year.

Freddie Mac tells us: “Declines in purchase demand continue to diminish while supply remains fairly tight….The consequence is that house prices likely will continue to rise, but at a slower pace for the rest of the summer.”

Home price growth may be slowing, yet the National Association of Realtors reports 148 of 185 metros still saw double-digit annual price growth in the second quarter—that’s 80% of the markets, up from 70% in the first quarter.


BUYERS & SELLERS August 3, 2022

Remodel or buy? How to make the right move

With home prices and interest rates rising across the country, you may be reevaluating your housing situation: Should you take advantage of the seller’s market and upgrade before interest rates rise further? Or should you leverage your home’s equity to finance a renovation?

It’s a significant decision that will depend on your specific financial situation and lifestyle. To help you through this tough decision-making process, here are a few things to consider:

Remodeling

Do you love your current neighborhood? Is it hard to imagine living anywhere else? If so, remodeling might be your best option.

Pros

Cons

  • Varied financing options: Cash, home equity loan, securities-based lending, personal loans and construction loans are just a few ways to fund a remodel.
  • Less expensive: Remodeling generally comes with a smaller price tag compared to buying a new home. For example, you would avoid the selling fees and broker commissions, which can be close to 6%, if you were to make a real estate purchase.
  • More control over your new space: You get to determine the floor plan, appliances, paint colors and other finishes.
  • Can increase the value of your home: If you eventually decide to sell, you may be able to recoup the money you spent on these improvements.
  • Physical constraints of existing property. For example, remodeling the kitchen is a feasible project for many homeowners, but adding square footage may not be realistic for properties in dense areas.
  • Construction delays and surprises: Rules and regulations can add to the expense of your project and/or delay the timeline. Additionally, remodelers frequently stumble upon hidden issues that complicate the process and increase costs.
  • Disruption to daily life: Turning your home into a construction site may test your patience. Depending on the size and scope of your project, you also may find you need to live elsewhere for a period — whether that be in a hotel or rental property.

Selling and buying

If your current home and neighborhood don’t suit your needs, selling your home and buying another one could be the best avenue for obtaining a house that will better suit your life.

Pros

Cons

  • May be a better long-term investmentif your new home is in a location that is more desirable than your current residence.
  • Tax benefits can be realized, such as mortgage interest deductions (as long as your mortgage balance is smaller than the price of your home). Plus, when you reinvest the profit from the sale of your current house into your next home purchase, you won’t have to pay capital gains tax.
  • More likely to suit your current lifestyle: Whether that means a shorter work commute or a bigger house to accommodate an evolving family dynamic, a new home can bring significant improvements to your daily life.
  • The current housing market: While a seller’s market may mean you’ll be able to offload your house easily, it also may make it tougher and more expensive to buy.
  • Rising interest rates: After a period of historic lows, interest rates on mortgages are seeing a steady uptick, which can negatively affect your purchasing power.
  • Buying a home is costly: Expenses include the property itself, appraisal, inspection, mortgage insurance and interest, homeowner’s insurances, realtor fees and closing costs, utilities and property taxes (which can vary greatly from county to county), listing costs, moving expenses and more.
  • Illiquidity: When you buy a more expensive home, more of your money is tied up in an asset that cannot be quickly sold for cash in the short term should an emergency need arise.

How to finance the option that’s right for you

Financing is a key part of this decision-making process and there are several solutions available to you, whether you choose to remodel or buy:

  • Personal cash reserves: Tapping into cash savings is a common way to finance a larger down payment or a renovation project.
  • Home equity loan or HELOC: A home equity loan is a lump-sum, fixed-rate loan that allows you to borrow against the equity you’ve built in your home. A home equity line of credit (HELOC) is similar, but interest rates fluctuate, making HELOCs less desirable in the current rising rates environment. Both allow you to maintain the cash you have on hand and are commonly used by homeowners to finance housing upgrades.
  • Securities-based line of credit: With this option, your eligible, nonqualified assets are used as collateral to secure financing — allowing you to get the funding you need for earnest money or a cash offer while remaining invested in the market.
  • Mortgage: Whether searching for a new primary home, vacation home or investment property, mortgage loans may be suitable for your purchase.

How does remodeling or buying fit in your financial situation?

Buying a new home or remodeling your current residence is a major life decision. We can help you find a strategic way to align your financial needs with your long-term goals and offer guidance on financing solutions to make your dream home a reality.

Real Estate Local Market August 3, 2022

Answers to your top 5 housing market questions

Russell Price, Chief Economist – Ameriprise Financial

Aug. 1, 2022

With home prices in many local markets reaching record levels in 2020 and 2021, homeowners and prospective homeowners alike are wondering what’s next for the housing market.

Ameriprise Financial Chief Economist Russell Price answers the top 5 real estate questions our clients are asking. 

1. What has caused home prices to appreciate so much over the last two years?

Strong demand and a lack of supply. National average home prices were 15% higher in 2021 after a 9% increase in 2020, according to the Federal Housing Finance Agency’s (FHFA) Home Price Index. Historically, prices have grown at a pace of about 5% per year.

The housing market was already tight before the pandemic. But demand accelerated after the Federal Reserve drove down mortgage borrowing costs to record lows to support economic activity. This made the monthly payment on a home, even a more expensive home, more manageable. At the same time, the number of homes available for sale in the U.S. declined as many people were unwilling or unable to move due to COVID-19 conditions.

2. What will happen to home prices in 2022 and 2023?

New and existing home sales have slowed in recent months amid the jump in mortgage rates. The national average 30-year fixed rate mortgage started the year at 3.1% and ended the month of June at 5.7%.  In June, existing home sales declined for the fifth straight month and at their slowest pace in two years. The median sales price, however, rose to a new record high of $416,000 in June, while mortgage applications over the last week dropped to lows last seen in 2000, according to the National Association of Realtors.

Though demand has slowed, the number of homes available for sale has remained close to historical lows.  As such, home prices are still likely to grow, but at a much slower pace. The home-listing website Zillow projects median national average home prices to rise by 9.7% over the next year (from May 2022 through May 2023).  For 2023, the Mortgage Bankers Association (MBA) and Fannie Mae predict existing home price growth of 3.1% and 3.2%, respectively.

So, potential buyers may have less competition for properties, but property values are still likely to move higher on average.

3. Are we in a housing bubble? Will there be a housing market crash similar to 2007–08?

No, we do not see current market conditions as being in a “bubble,” and we certainly do not see a correction similar to the crash of 2007–08 as likely.

During the period leading up to that crash, too many mortgages had been granted to individuals who did not have the financial position to manage the mortgage payments. Many home loans were also made with no money down, so new owners had no equity in the property. When home prices eventually declined, this made it easy for the mortgage holder to simply walk away from the property, thus fueling the crash. Today, mortgage holders have much stronger credit profiles and equity in the property. The majority of home loans made over the last two years have gone to those with high credit scores (760+) rather than the low scores of the Housing Bubble period, according to the New York Federal Reserve.

Additionally, the housing market in 2007 offered a surplus of homes for sale. Too many homes had been built in the preceding years. By contrast, in the decade prior to the COVID-19 pandemic, new home construction did not keep up with the demands of a rising population, in our view.

4. Is the U.S. housing market currently overvalued?

To say the housing market is over- or under-valued is subjective and may differ materially from one local market to the next. The home you want may not come down in price anytime soon, if ever. Regardless of conditions, it’s best not to overstretch your budget to buy a house you can’t afford.

New home prices, however, have been seeing some relief. And potential buyers for newly built properties may see more attractive pricing in the months ahead. Although mortgage borrowing costs are up, building costs for such key inputs as lumber and copper have declined significantly in recent months while prices for such items as carpeting and appliances have eased as well. The overall pace of new building activity has also stabilized somewhat, which could help ease labor costs in the segment.

5. With the recent increase in home prices, will housing affordability become an issue for the U.S. economy?

Today’s high property prices and rising mortgage rates make housing increasingly unaffordable for a growing share of the population.

Unfortunately, housing affordability has been a problem in the economy for several years. Since the years immediately following the Great Recession (2007–09), the economy has suffered from a lack of affordablehousing — that is, homes priced in a range that first-time buyers or families with modest incomes can afford. Given the tight supply of homes, builders have been incentivized to build larger homes where their profit margins are larger.  As availability in these higher-priced segments grows, however, we have seen some evidence of builders slowly moving down the price-point scale.

How does your home factor into your financial situation?

For many Americans, the home is one of their most valuable financial assets. Talk with your Ameriprise financial advisor about how your home figures into your broader financial portfolio and goals.

Real Estate Local Market July 24, 2022

NAR Study: International Buyers Are Back …. by Kerry Smith

NAR Study: International Buyers Are Back …. 

by Kerry Smith

In NAR’s annual report, 1 in 4 (24%) international buyers chose Fla. Nationwide, they spent $5.9B, up 8.5%, even as single-family home sales dropped 7.9%.

WASHINGTON – Foreign buyers purchased $59 billion worth of U.S. existing homes over a one-year period (April 2021 through March 2022) – an 8.5% increase from the previous 12-month period and the end of a pandemic-led, three-year skid.

The 98,600 existing homes sold – the lowest since NAR tracking began in 2009 – were down 7.9% year-to-year.

Overall, however, Florida led the nation in welcoming foreign investment as one in four international buyers (24%) selected property in the Sunshine State.

Top international buyer destinations

  1. Florida (24%)
  2. California (11%)
  3. Texas (8%)
  4. Arizona (7%)
  5. New York (4%)
  6. North Carolina (4%)

Florida ranking among residents of foreign countries

  • Canada: Florida was the No. 1 choice for 45% of Canadians
  • China: Florida No. 4 for 7%
  • Brazil: Florida No. 1 for 55%
  • Mexico: Florida No. 2 for 12%
  • Colombia: Florida No. 1 for 60%

Region of origin for Florida’s top foreign buyers

  • Latin America/Caribbean: 39%
  • North America: 25%
  • Europe: 12%
  • Asia/Oceania: 4%
  • Africa: 0%
  • Region not identified 20%

“For the second year in a row, restrictions and general caution tied to international travel during the pandemic slowed home buying by wealthier foreign buyers,” says NAR Chief Economist Lawrence Yun. “Even so, domestic home buying demand was exceptional and, therefore, boosted home sales nationally.”

NAR’s 2022 Profile of International Transactions in U.S. Residential Real Estate surveyed members about transactions with international clients who purchased and sold U.S. residential property from April 2021 through March 2022.

Foreign buyers who resided in the U.S. as recent immigrants or holding visas that allowed them to live in the U.S. purchased $34.1 billion worth of U.S. existing homes, a 5.2% increase from the prior year and 58% of the total dollar volume of purchases.

Foreign buyers who lived abroad purchased $24.9 billion worth of existing homes, up 13.2% from the 12 months prior and for 42% of the dollar volume. International buyers accounted for 2.6% of the $2.3 trillion in existing-home sales during the time period.

Typical foreign buyer home

The average ($598,200) and median ($366,100) existing-home sales prices among international buyers were the highest ever recorded by NAR – and 17.7% and 4.1% higher, respectively, than the previous year. The increase in foreign buyer prices partly reflects the increase in U.S. home prices, as the monthly average existing-home sales price rose to $374,300, up 10% from the prior period.

At just over $1 million, Chinese buyers had the highest average purchase price, and nearly a third – 31% – purchased property in California.

“Affordability challenges along with the inability to find the right property were the top reasons given for prospective international buyers who showed interest but ultimately did not purchase a home in the United States,” says Yun.

China and Canada remained first and second in U.S. residential sales dollar volume at $6.1 billion and $5.5 billion, respectively, continuing a trend going back to 2013. India ($3.6 billion), Mexico ($2.9 billion), and Brazil ($1.6 billion) rounded out the top five.

For the 14th straight year, Florida remained the top destination for foreign buyers.

All-cash sales accounted for 44% of international buyer transactions, nearly twice the rate (24%) of all existing-home buyers. Non-resident foreign buyers (60%) were twice as likely to make an all-cash purchase compared to resident foreign buyers (30%). Nearly 7 out of 10 Canadian buyers (69%) made all-cash purchases, the highest share among foreign buyers. Asian Indian buyers were the least likely to pay all-cash, at just 9%. Almost 6 out of 10 Chinese buyers (58%) and a quarter of Mexican (27%) and Brazilian buyers (26%) made all-cash purchases.

“Due to rising interest rates, overall home sales will decline in the U.S. this year. Foreign buyers, however, are likely to step up purchases, as those making all-cash offers will be immune from changes in interest rates,” Yun says. “In addition, international flights have increased in recent months with the lifting of pandemic-related travel restrictions.”

Type of homes purchased

  • 44% of foreign buyers purchased their property for use as a vacation home, rental property or both.
  • 64% purchased detached single-family homes and townhouses.
  • 46% bought a home in the suburbs while 29% bought a home in an urban area, numbers which have held steady over the last five years.
  • 5% bought property in a resort area, down from 17% in 2012

NAR “collaborates with groups across the country to help our members unlock and better understand the opportunities in U.S. real estate for foreign buyers, maximizing the global business potential in our local markets,” says Katie Johnson, NAR’s general counsel and chief member experience officer. The network has grown to include more than 100 real estate associations across 76 countries.”

© 2022 Florida Realtors®

Real Estate Local Market July 20, 2022

Housing Inventory Continues to Grow in Sarasota and Manatee

Courtesy of RASM Market Statistics.

SARASOTA, Fla. (July 20, 2022) – With rising interest rates across the country, the Sarasota and Manatee housing market is beginning to see more and more homes available for purchase when compared to last year. According to data from Florida REALTORS® and compiled by the REALTOR® Association of Sarasota and Manatee (RASM), closed sales have once again decreased overall. Record-high prices coupled with the rising mortgage rates point to an increase in inventory this month, with active listings increasing by more than 100 percent from last year.

REALTORS® participated in 2,088 sales across the two-county region in June, a 26.7 percent decrease from the same month last year. In Manatee County, single-family sales decreased from last year by 22.3 percent to 645 sales, while condo sales decreased by 23.6 percent to 265 closed sales. In Sarasota County, single-family sales decreased by 26.9 percent to 802 sales, and condo sales are down by 34.6 percent to 376 sales.

“While we’re continuing to see month-over-month and year-over-year increases in pricing, the number of closed sales has dropped down to a level that was more typical for a pre-pandemic June,” said 2022 RASM President Tony Veldkamp, a Senior Advisor at SVN Commercial Advisory Group. “Meanwhile, the amount of active inventory continues to grow by more than double the number of listings from where we were this time last year. At less than a 2-month supply of single-family homes, we are still far from having the 6-month inventory required for market equilibrium. The market is shifting as we’re seeing changes in the buying process, but today we’re still in a seller’s market.”

The median sales price in the two-county area continues to increase. In Sarasota County, the median price for single-family homes increased by 25 percent to the highest recorded price of $500,000, while condo prices increased by 34.4 percent to $416,250. In Manatee County, single-family home prices increased year-over-year by 35.7 percent to $550,000, which was the same price recorded in May 2022. The median price of condos in Manatee County was $356,500, which is a 27.3 percent increase from last year.

At the end of June, there were 3,554 active listings combined in the two counties for both markets, which is a 131.4 percent increase from last year. There were 998 more active listings reported at the end of June than at the end of May, indicating a month-over-month increase of 39.1 percent.

The months’ supply of inventory, or the number of months it will take to deplete the current inventory given recent sales rates, has increased year-over-year. In the single-family home market, Manatee County
inventory is at a 1.8-month supply, which is a 200 percent increase from the same month last year, while Sarasota increased by 142.9 percent to a 1.7-month supply. The months’ supply for condos is 1.5-months, a 200 percent increase in Manatee County and a 150 percent increase for Sarasota County.

Properties are still going under contract in seven days or less, with the median time reported at six days for single-family homes in Manatee County and at seven days for single-family homes in Sarasota County. The median time for condos to go under contract is at seven days for both counties.

New listings, or the number of properties added to the market last month, increased year-over-year in the North Port-Sarasota-Bradenton MSA by 24.9 percent for single-family homes and by 19.1 percent for condos. Compared to May of 2022, new listings increased by 2.5 percent for the combined numbers in both counties and both markets.

Monthly reports are provided by Florida REALTORS® with data compiled from Stellar MLS. For comprehensive statistics dating back to 2005, visit www.MyRASM.com/statistics.

Click here for the June 2022 Press Release and Statistics.

Real Estate Local Market June 30, 2022

Nations Top 20 – has Sarasota as No 1 !!! Nov 2021

U.S. News & World Report: Fla. Has 8 of Top 10 ‘Best Retirement’ Metros
By Phil Fernandez

The magazine’s 2021 list ranks Fla. metros in the top four spots– Sarasota, Naples, Daytona Beach and Melbourne – but 7 other Fla. metros also made it into the top 20.

NAPLES, Fla. – It may be getting more expensive to live, but Southwest Florida remains at the top of the “Best Places to Retire” in the country, based on the latest research by U.S. News & World Report.

The state’s metros led the way in the annual findings released this morning by the magazine, with the first four in this order: Sarasota, Naples, Daytona Beach and Melbourne.

U.S. News & World Report’s Florida rankings in nation’s top 20
1. Sarasota

2. Naples

3. Daytona Beach

4. Melbourne

6. Tampa Bay

7. Fort Myers

8. Port St. Lucie

10. Pensacola

12. Lakeland

16. Ocala

18. Orlando

“Many retirees are continuing to dream about a Florida beach retirement,” said Emily Brandon, U.S. News senior editor for retirement.

“Sarasota and Naples residents both report a high sense of well-being, and both cities scored high marks for desirability. Sarasota edged out Naples for the No. 1 spot largely due to Sarasota having more affordable housing than Naples.”

Despite Florida’s dominance, another state is rapidly rising, and it’s not the usual rivals for retirees, such as Arizona, Texas and California. It’s the commonwealth of Pennsylvania scraping away at its Rust Belt labeling.

“Several Pennsylvania cities climbed in the rankings this year, often due to the accessibility of high-quality health care facilities,” Brandon told me, noting efforts being made in places like No. 5 Lancaster. “Many old warehouses and buildings in Lancaster have been transformed into restaurants and bars with a diverse collection of cuisines.”

Keystone State areas breaking into the top 25 this year include Allentown (No. 11), Harrisburg (No. 13), Reading (No. 15), York (No. 17), Philadelphia (No. 19) and President Biden’s birthplace Scranton, which catapulted 87 places to reach No. 21.

Nearly three quarters of metro areas in the top 25 are located in Florida or Pennsylvania.

But it’s hard to compete with the Sunshine State, which besides retirees, already has become a destination for executives buying mansions. Part of a Pennsylvania pipeline In the Know reported on, the CEOs of Philadelphia-based electronics giant Ametek and major retailer Five Below are among those who have moved into estates in the Naples area, where they recently opened corporate offices.

“Florida dominates this year’s ranking of the Best Places to Retire, taking eight of the top 10 spots on the list,” said Brandon, who also looked at murder, theft and vandalism as part of the study that solidified the top two slots. “We did see that Sarasota and Naples have lower crime rates than some other parts of Florida.”

‘Our big thing … no state tax’
The peninsula nailed down 11 of the top 18 even though Florida isn’t as cheap as it used to be.

Naples, for example, is one of 17 metro areas with places like San Diego, Boston and Honolulu, where a buyer needed more than $100,000 in household income to affordably pay a 10% down payment mortgage, according to National Association of Realtors second quarter data.

Enter Daytona, which rose from 15th on last year’s U.S. News list.

“Daytona Beach has the most affordable housing costs of any of the top 10 best places to retire,” Brandon told me. “The cost of living in a potential retirement spot is a major concern for many retirees.”

Sarasota and Naples, however, are able to overcome that in Brandon’s view.

“They are also looking for a high quality of life,” she said. “Naples has the highest housing costs among the 10 best places to retire, but Naples scored high marks for desirability and the happiness of current residents. All of the Florida cities benefited from low tax rates since there is no state income tax.”

That’s definitely playing a role in the surging growth, said Collier County Commissioner Rick LoCastro, whose district includes Marco Island and part of the Naples area.

“Here, our big thing, has always been no state tax,” LoCastro told me recently. “As the market has fluctuated, and as people may be a little more educated on their finances and their retirements, it’s one of the reasons.”

‘Busiest summer ever’
In 1990, the four I-75 coastal counties of Collier, Lee, Charlotte and Sarasota had a population of 876,000 combined. Today, it’s nearly a million more at 1.8 million.

Coronavirus and the desire to get away from that and the tighter spaces of big city metros to come to green open spaces and sandy beaches has brought more arrivals.

“We surveyed Americans age 45 and older about their interest in retiring in a given metropolitan area, and there is continued interest in Florida retirement destinations,” Brandon told me. “Our survey data found that 23% of Americans who are at or near retirement say the pandemic has changed their preference for where they would like to retire. (Many) soon-to-be retirees are still dreaming about Florida.”

As In the Know has reported, the Fort Myers, Sarasota and Lakeland metro areas were among the 10 fastest growing nationally in the past year among metros with at least 500,000. If Naples, with 400,000, had met that minimum threshold for study, it would have been on the list or close to it.

“Busiest summer ever,” said Grant Phelan, a restauranteur since 1997 who noted that many of the newcomers aren’t just here for the winter anymore. “Southwest Florida is definitely a different town after COVID. No question. A lot of people have moved here. And these aren’t six-month residents. These are people who have moved here for 12 months. They’re going to live here.”

Very few businesspeople know the Southwest Florida Gulf coast better than Phelan, who grew up in the region and operates nearly 20 family-run eateries from Tampa Bay’s Wesley Chapel to Key West’s Duval Street including the seafood-oriented Pinchers restaurant.

“It’s our footprint,” said Phelan, who says this historic growth period will be marked in the annals of time as “Before COVID” and “After COVID.” “I think we will refer to it is B.C. and A.C. I really do. Southwest Florida, A.C., it just went WSHHHOOOH,” making a rocket sound while shooting his hand and arm upward.

Mike Hughes, vice-president of Downing-Frye Realty Inc., has been predicting they’re going to keep coming.

“I see the demand staying strong for a while. The one thing that’s still out there is that we have a huge baby boomer generation that’s coming up on retirement. So as many of them are approaching the retirement years, a lot of them have eyes toward Florida, and Southwest Florida, in particular,” Hughes said. “I think we’re heading into an interesting period.”

No sign of Arizona, Texas, California
It may not be as fascinating for areas that traditionally have drawn retirees. The top metro for Texas came in the form of No. 50 Austin. Consider that the best Arizona could do was No. 116 Tucson. And California? No. 118 Santa Barbara.

“We did see continuing interest in retirement in Arizona, but several Arizona cities had low ratings on the air quality index,” Brandon told me. “High housing prices often make it difficult for people on a budget to retire in California.”

Miami dropped from No. 9 to No. 48 due to decreases in housing affordability, desirability, happiness, job market and health care scores. Jacksonville fell from No. 13 to No. 26 for similar reasons, although its job market score increased.

The only midwestern locale ranking among the best 25 is No. 9 Ann Arbor, home to the University of Michigan and a vibrant, diverse downtown for all ages. Besides Pennsylvania, the only other northeastern area near the top was No. 24, Manchester, New Hampshire.

The new list evaluated the country’s 150 most populous metropolitan areas based on how well they meet Americans’ expectations for retirement, with measures including affordability, health care and overall happiness.

The 2021-22 Best Places to Retire Top 25 metro areas

1. Sarasota 🙂
2. Naples
3. Daytona Beach
4. Melbourne
5. Lancaster, Pennsylvania
6. Tampa
7. Fort Myers
8. Port St. Lucie
9. Ann Arbor, Michigan
10. Pensacola
11. Allentown, Pennsylvania
12. Lakeland
13. Harrisburg, Pennsylvania
14. Asheville, North Carolina
15. Reading, Pennsylvania
16. Ocala
17. York, Pennsylvania
18. Orlando
19. Philadelphia
20. Knoxville
21. Scranton, Pennsylvania
22. Raleigh & Durham, North Carolina
23. Nashville, Tennessee
24. Manchester, New Hampshire
25. Myrtle Beach, South Carolina

Copyright © 2021, Daily Commercial, all rights reserved. Based at the Naples Daily News, columnist Phil Fernandez writes In the Know as part of the USA TODAY NETWORK.

BUYERS & SELLERSReal Estate Local Market June 30, 2022

Property Fraud Alerts, a growing Problem … 2021

Property Fraud Alerts in Sarasota and Manatee Counties….

Property and identity fraud are a nationwide problem. By filing fake deeds, scammers appear to own property, and can fraudulently rent or sell the property without the knowledge of the true owner. Your Sarasota Clerk and Comptroller wants to help you in protecting against property fraud. By signing up for FREE property fraud alerts, you will receive an email alert whenever a document is recorded in Sarasota County using your personal or business name. Notifications are sent within 48 hours of the document being recorded, alerting you so you can choose to review documents through public records, or dispute through law enforcement. Just register, receive alerts, and react. It’s that simple.

For more information, refer to the Frequently Asked Questions for details.

To get started please enter your email. A verification email will be sent with a link to the fraud alert setup page.

Already enrolled? Click login to manage your alerts.

Sarasota County: https://secure.sarasotaclerk.com/ORFraudAlerts.aspx

Manatee County: https://www.manateeclerk.com/online-services/property-fraud-alerts/

For more information in Manatee:   Click here

Register for property fraud alerts. Receive e-alerts when documents are filed in your name.

React if needed by reporting to law enforcement.


Real Estate Local Market June 30, 2022

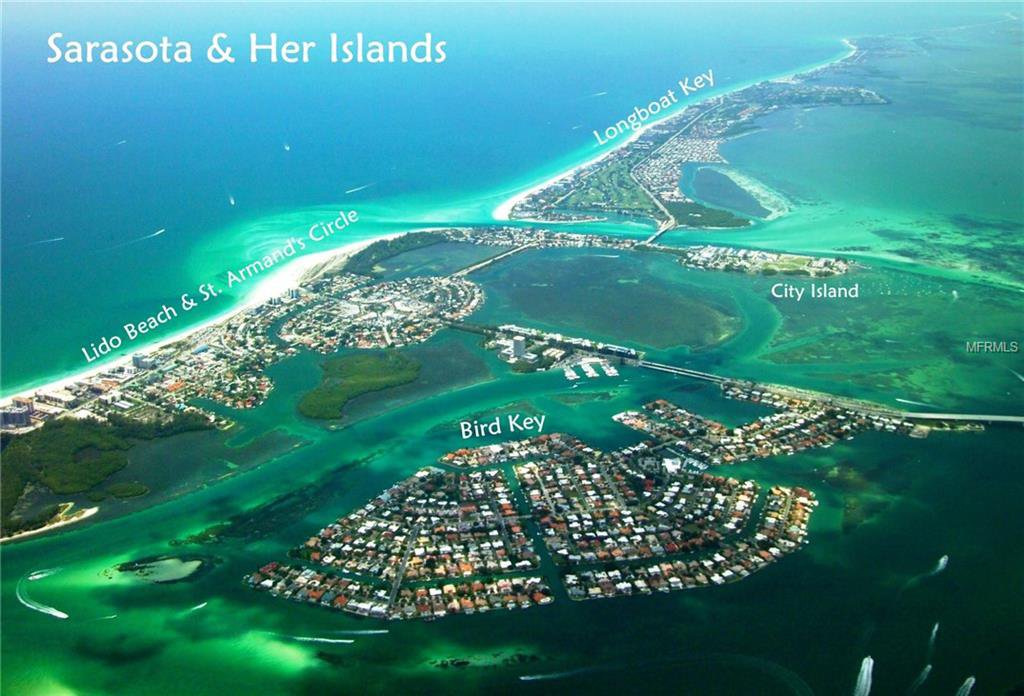
Longboat Key Named Fifth Best Island in the U.S… 2021

The annual reader-sourced “World’s Best” list invites Travel + Leisure’s audience to vote on the best destinations and experiences worldwide.

Travel + Leisure recently ranked Longboat Key as the No. 5 best island in the U.S. in its 2021 “World’s Best” awards. The annual reader-sourced list invites Travel + Leisure’s audience to vote on the best destinations and experiences worldwide. The awards honor the top travel destinations, hotels, companies, and, for the first time this year, national parks. Normally released in August, Travel + Leisure moved the issue to October to allow for more time given the restrictions brought on by the pandemic.

Longboat Key, which straddles both Sarasota and Manatee counties, features 12 miles of beaches, waterfront golf courses and a number of fine-dining restaurants and luxury hotels, including the new St. Regis Resort and Spa, which will also feature multimillion-dollar residential condos.

Other Florida islands that made the list: Amelia Island (No. 3), the Florida Keys (No. 10), Captiva Island (No. 11), and Sanibel Island (No. 13).

Winners will appear in the October 2021 issue of Travel + Leisure magazine; you can also see the list here.

Source: SAGACITY MEDIA © 2021 SagaCity Media

If you want to purchase and live on Longboat Key, contact Gina Larouche, to help you. 941-323-0256